EVQ-218 research results and test data
EVQ-218 is backed by peer-reviewed characterization, broad-spectrum in vitro antimicrobial testing, serial-passage research across six ESKAPE pathogens, and third-party biocompatibility and application testing. Results reflect the materials, methods, concentrations, and conditions reported in each study. Follow the source links for full context.
How to read the evidence
EVQ-218 has been evaluated at several levels: physicochemical characterization of the material itself; antimicrobial susceptibility testing in liquid culture; performance after integration into coatings, polymers, and device formats; and biocompatibility testing under defined protocols. These evidence classes answer different questions and should not be treated as interchangeable.
| Evidence class | What it establishes | Primary limitation |
|---|---|---|
| Material characterization | Particle morphology, size distribution, surface chemistry, dissolution, and stability | Does not establish clinical performance |
| Antimicrobial susceptibility | In vitro activity across the organisms and isolates tested | Depends on assay conditions and concentration |
| Integrated-format testing | Activity after incorporation into a specific coating, polymer, or device format | Applies to the tested formulation and process |
| Biocompatibility and toxicology | Response under a defined test protocol and exposure design | Does not replace application-specific safety evaluation |
Broad-spectrum antimicrobial testing
Third-party in vitro testing evaluated EVQ-218 across bacterial, fungal, yeast, and mycobacterial isolates, including resistant strains. Minimum inhibitory concentration (MIC) values below are study measurements, not dosing recommendations or clinical claims.
Species breakdown and MIC ranges
| Pathogen species | Type | Gram status | Total strains | Resistant strains | Non-resistant MIC range (µg/mL) | Resistant MIC range (µg/mL) | Average MIC |
|---|---|---|---|---|---|---|---|
| Pseudomonas aeruginosa | Bacteria | Gram negative | 7 | 7 | 0.75-0.75 | 0.25-1 | 0.63 |
| Achromobacter xylosoxidans | Bacteria | Gram negative | 4 | 0 | 0.025-0.75 | N/A | 0.26 |
| Stenotrophomonas maltophilia | Bacteria | Gram negative | 4 | 0 | 0.25-0.5 | N/A | 0.44 |
| Burkholderia cenocepacia | Bacteria | Gram negative | 3 | 0 | 0.125-0.25 | N/A | 0.17 |
| Burkholderia gladioli | Bacteria | Gram negative | 2 | 0 | 0.06-0.125 | N/A | 0.09 |
| Burkholderia multivorans | Bacteria | Gram negative | 2 | 0 | 0.125-0.125 | N/A | 0.13 |
| Haemophilus influenzae | Bacteria | Gram negative | 2 | 0 | 0.25-0.25 | N/A | 0.25 |
| Burkholderia cepacia | Bacteria | Gram negative | 1 | 0 | 0.13 | N/A | 0.125 |
| Burkholderia dolosa | Bacteria | Gram negative | 1 | 0 | 0.25 | N/A | 0.25 |
| Burkholderia vietnamiensis | Bacteria | Gram negative | 1 | 0 | 0.25 | N/A | 0.25 |
| Staphylococcus aureus | Bacteria | Gram positive | 17 | 7 | 1-16 | 2-16 | 5.63 |
| Mycobacterium abscessus/massiliense | Bacteria | Acid-fast | 9 | 0 | 7.5-10 | N/A | 8 |
| Mycobacterium avium complex | Bacteria | Acid-fast | 3 | 0 | 2.5-10 | N/A | 5.42 |
| Mycobacterium abscessus subsp. abscessus | Bacteria | Acid-fast | 1 | 0 | 10.00 | N/A | 10 |
| Mycobacterium smegmatis | Bacteria | Acid-fast | 1 | 0 | 0.75 | N/A | 0.75 |
| Aspergillus fumigatus | Fungus | N/A | 2 | 0 | 2.5-2.5 | N/A | 2.5 |
| Scedosporium apiospermum | Fungus | N/A | 1 | 0 | 0.50 | N/A | 0.5 |
| Candida albicans | Yeast | N/A | 1 | 0 | 0.13 | N/A | 0.125 |
| Candida parapsilosis | Yeast | N/A | 1 | 0 | 0.13 | N/A | 0.125 |
| Pichia angusta | Yeast | N/A | 1 | 0 | 0.50 | N/A | 0.5 |
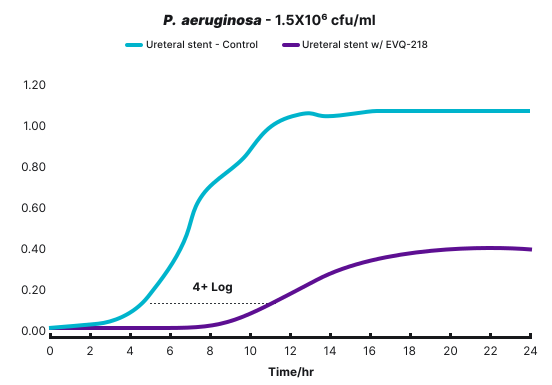
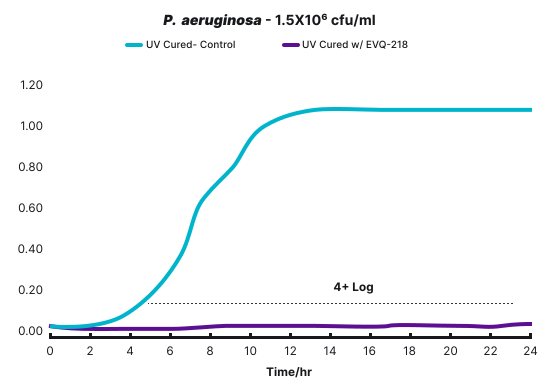
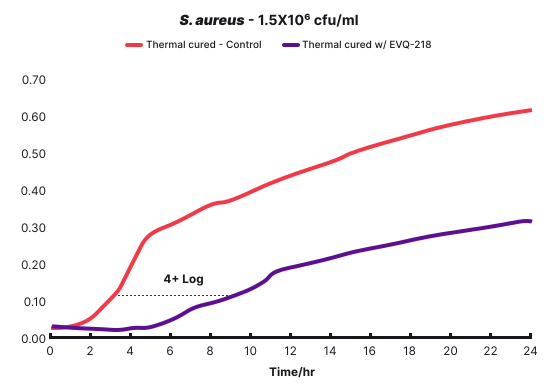
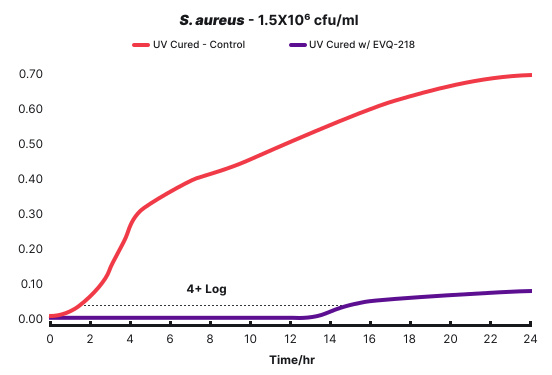
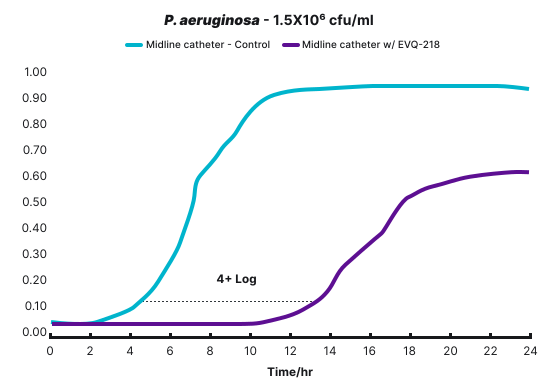
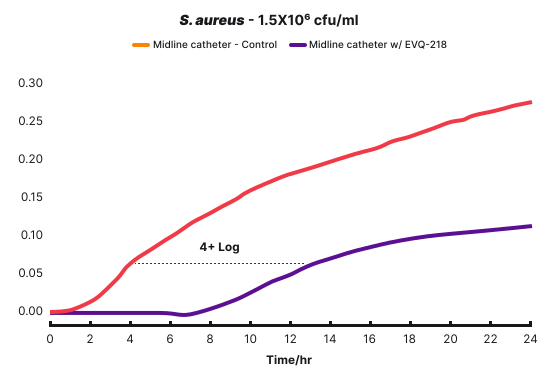
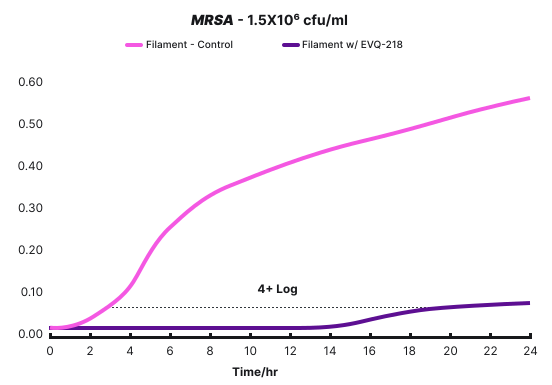
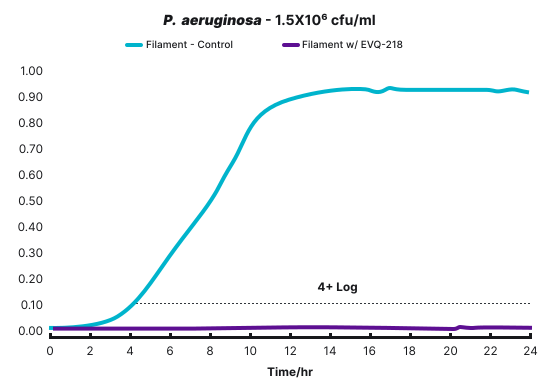
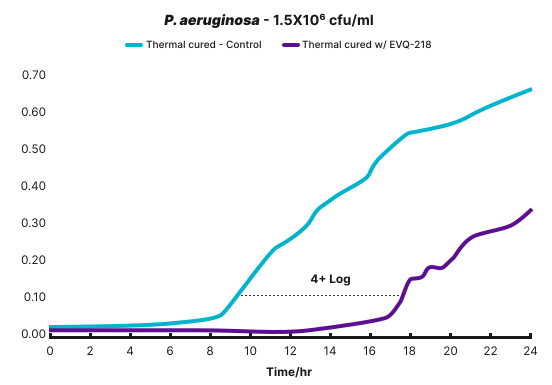
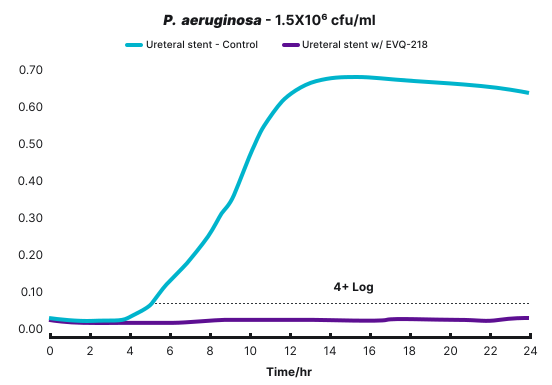
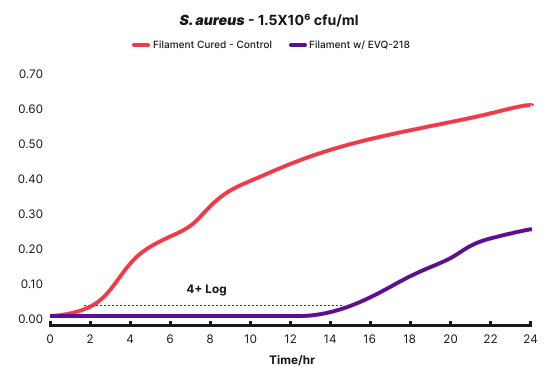
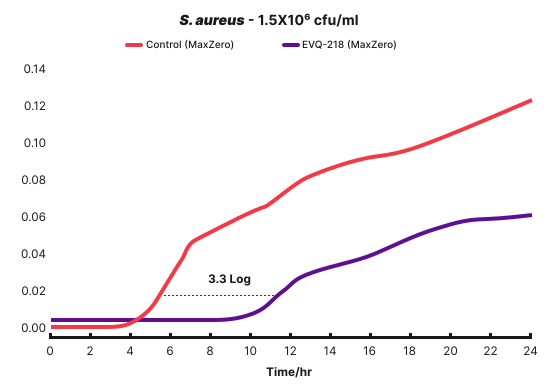
Integrated-material results
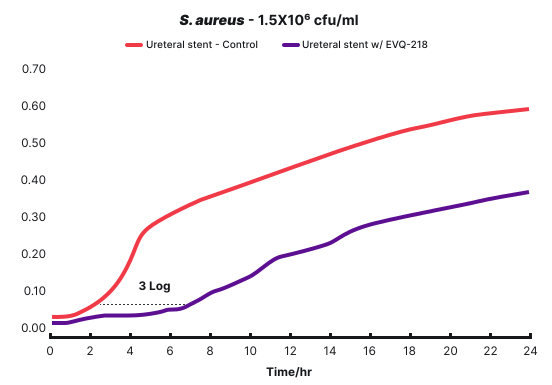
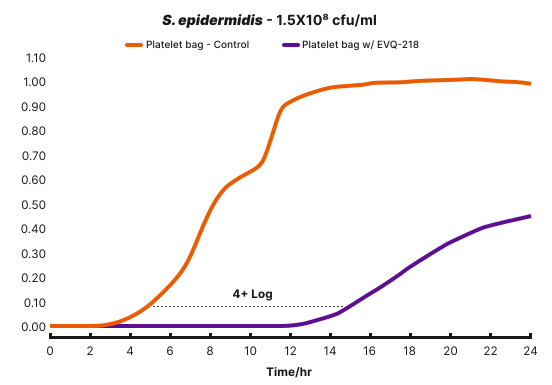
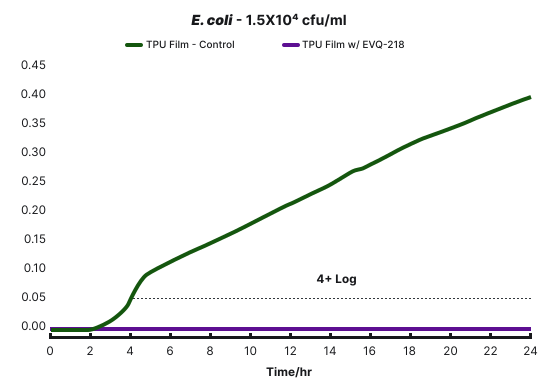
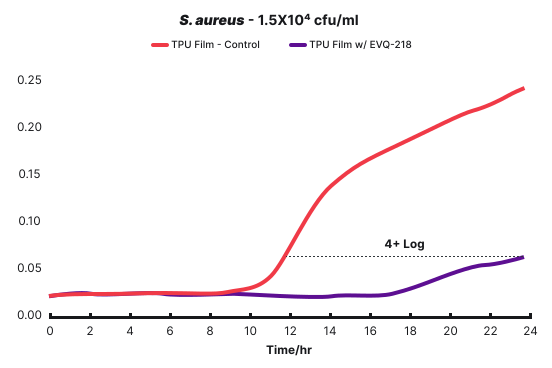
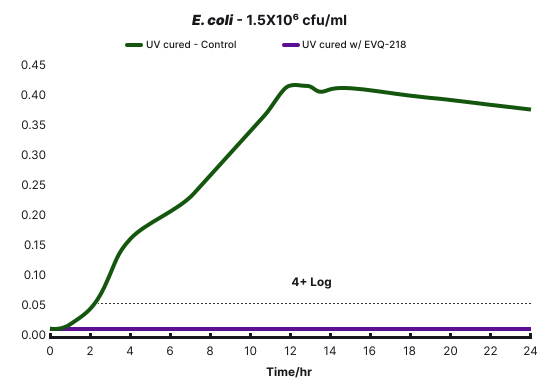
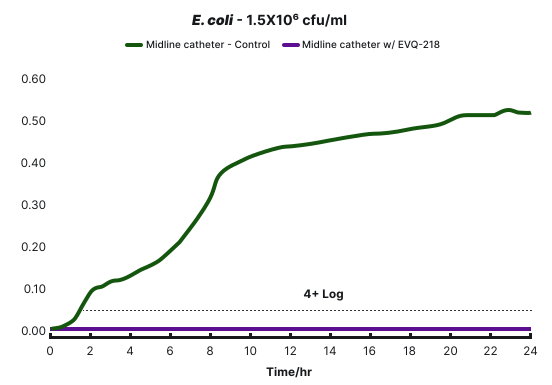
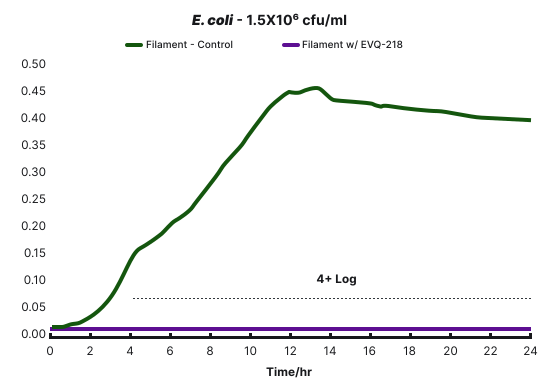
Each chart represents a particular organism, material format, application method, and test condition. A 4+ log result means the reported reduction was at least four orders of magnitude under that assay.

Biocompatibility and toxicology
ISO 10993-5 MEM elution cytotoxicity
| Test or control article | Replicates | Reactivity grade | Description | Result |
|---|---|---|---|---|
| EVQ218-T and EVQ218-T/IPA | 1-3 | 0 | No cell lysis or morphological changes | Non-cytotoxic under the test conditions |
| Negative control (USP) | 1-3 | 0 | No reactivity | Pass |
| Reagent control | 1-3 | 0 | No reactivity | Pass |
| Positive control | 1-3 | 4 | Nearly complete lysis | Pass; assay validation |
The EVQ-218 test articles received reactivity grade 0 across all replicates and met the ISO 10993-5 acceptance criterion in this MEM elution study. Review the study summary and source report for specimen preparation and protocol details.
Inhalation toxicology
| Group | Target concentration (mg/m³) | Presented dose (mg/kg/day) | Deposited dose* (mg/kg/day) | Duration |
|---|---|---|---|---|
| 1 | 0.5 | 0.014 | 0.0014 | Single and 7-day repeat |
| 2 | 2.0 | 0.057 | 0.0057 | Single and 7-day repeat |
| 3 | 5.0 | 0.143 | 0.0143 | Single and 7-day repeat |
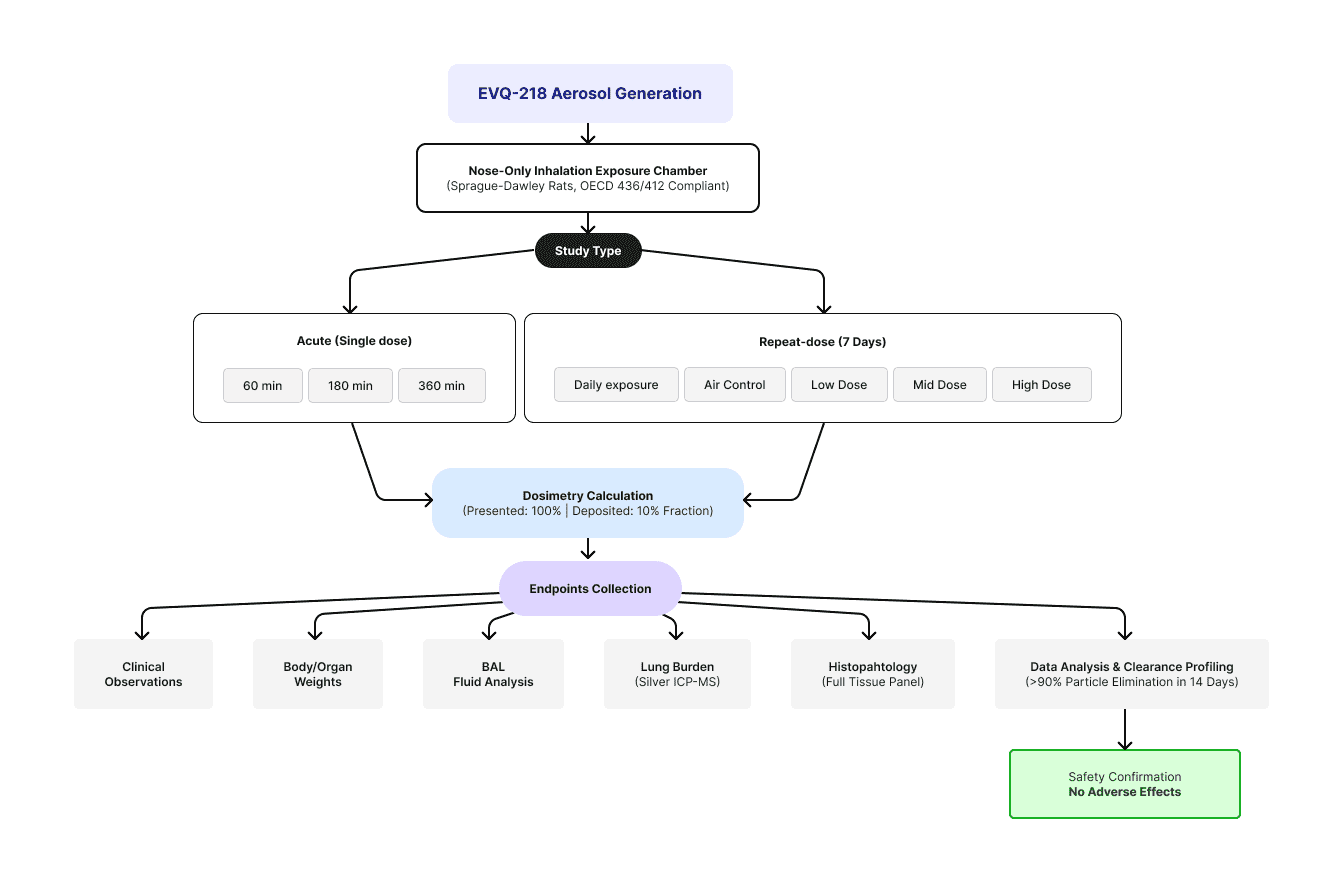
No treatment-related clinical signs, body-weight effects, gross pathology, or histopathological changes were reported at the study dose levels. This result applies to the protocol, material, dose calculation, and exposure schedule evaluated.
Study design and methodology
The evidence record retains the study protocol, dose calculations, exposure schedule, laboratory report reference, and the clinical and histopathology endpoints used to evaluate the material.
Serial-passage resistance assessment
Peer-reviewed studies evaluated whether repeated EVQ-218 exposure produced measurable shifts in susceptibility across all six ESKAPE pathogens.
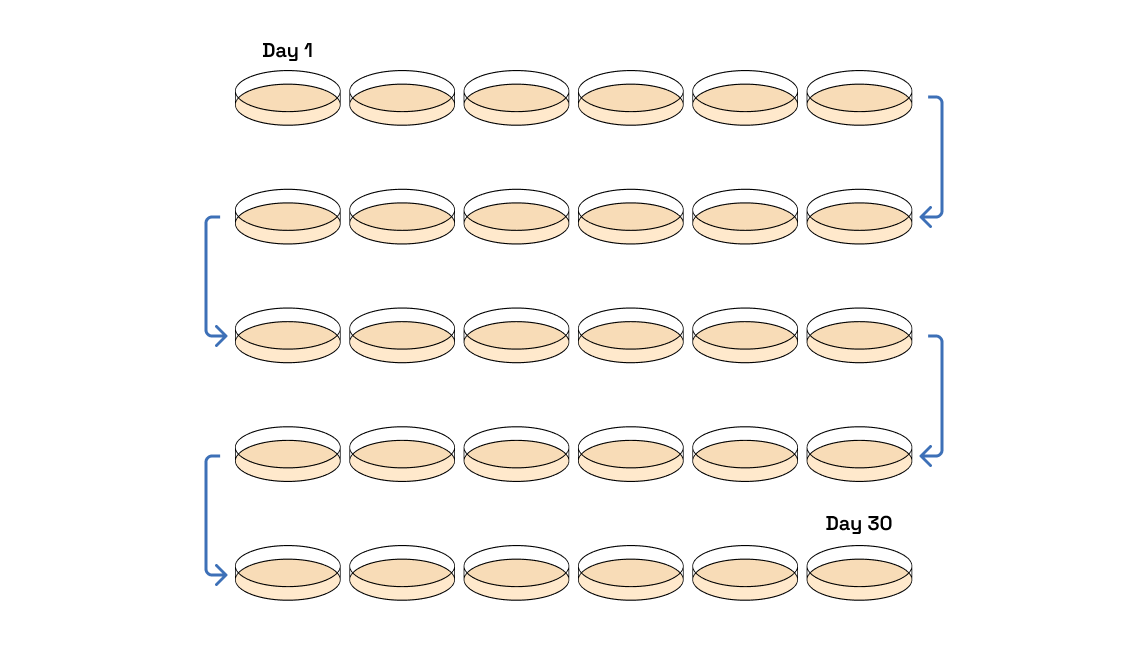
The 30-passage baseline study and a 20-passage escalating-pressure study reported no resistance development under their respective in vitro conditions. These findings do not guarantee behavior in every organism, environment, or timescale.
Study design summary
| Study | Duration | Exposure strategy | Pathogen panel | Reported observation |
|---|---|---|---|---|
| Baseline serial passage | 30 passages | Constant sub-lethal concentration of 0.156 µg/mL | Six ESKAPE ATCC strains | No resistance development reported |
| Enhanced serial passage | 20 passages | Stepwise concentration escalation from 0.5 to 4 µg/mL | Six ESKAPE ATCC strains | No resistance development reported |
Pathogens evaluated
Enterococcus faecium, Staphylococcus aureus, Klebsiella pneumoniae, Acinetobacter baumannii, Pseudomonas aeruginosa, and Enterobacter cloacae.
Review the serial-passage publication listing and related evidence on the Learn page. A focused explainer remains in editorial review and is not yet published.
Early device-format encrustation testing
EVQ-218 was evaluated in an early device-format encrustation study. Treated and untreated samples were submerged in concentrated artificial urine under stationary conditions, monitored over time, and examined using SEM imaging.
The comparison used untreated controls and filaments containing EVQ-218. Time-lapse observation tracked visible crystal formation, while SEM imaging examined differences in crystal shape and morphology. This was an early, controlled material-format study rather than a clinical device trial.
Primary sources and independent testing
- ACS Omega physicochemical characterization paper
- Antibiotics: peer-reviewed serial-passage and cross-resistance publication
- Cystic Fibrosis Foundation: support for broad-spectrum in vitro antimicrobial testing
- Seattle Children’s Research Institute: antimicrobial susceptibility testing
- NAMSA ISO 10993-5 MEM elution report
- GLP dermal sensitization report
- Lovelace Biomedical: inhalation-toxicology study
- Galbraith Laboratories: ICP-MS analysis supporting exposure and tissue-level measurements
Where a full source document is available in the resource library, the detail page links directly to it. Additional reports should be published with protocol and source-document context before launch.